
Reports
The Reports page gathers the company's management reports in four tabs: Sales performance, Marketing ROI, Collections & cash flow and Inventory status. Each one can be downloaded as an Excel file. Managers use it to follow their teams against target, marketing to judge campaigns, and Finance to plan cash. The reports always cover the whole company.
Who sees which report
| Report | Who (built-in roles) |
|---|---|
| Sales performance | Company admins, sales managers, team leaders, Finance and Marketing |
| Marketing ROI | Company admins, sales managers and Marketing |
| Collections & cash flow | Company admins, sales managers and Finance |
| Inventory status | Everyone who can open the Reports page |
Reports appears in the menu only for people who can see at least one of the first three reports. Sales agents do not have it by default; they follow their own numbers on the Dashboard and the Sales funnel page. If your company uses its own roles, it depends on the rights given to the role (see Roles and access).
Choosing the period and exporting
- The date range at the top applies to Sales performance and Marketing ROI. By default it starts on the 1st of the month two months ago and ends today (about three months).
- Collections & cash flow and Inventory status do not use the date range (see below).
- Export downloads the tab you are on as an Excel file, with the same filters as on screen.
Sales performance
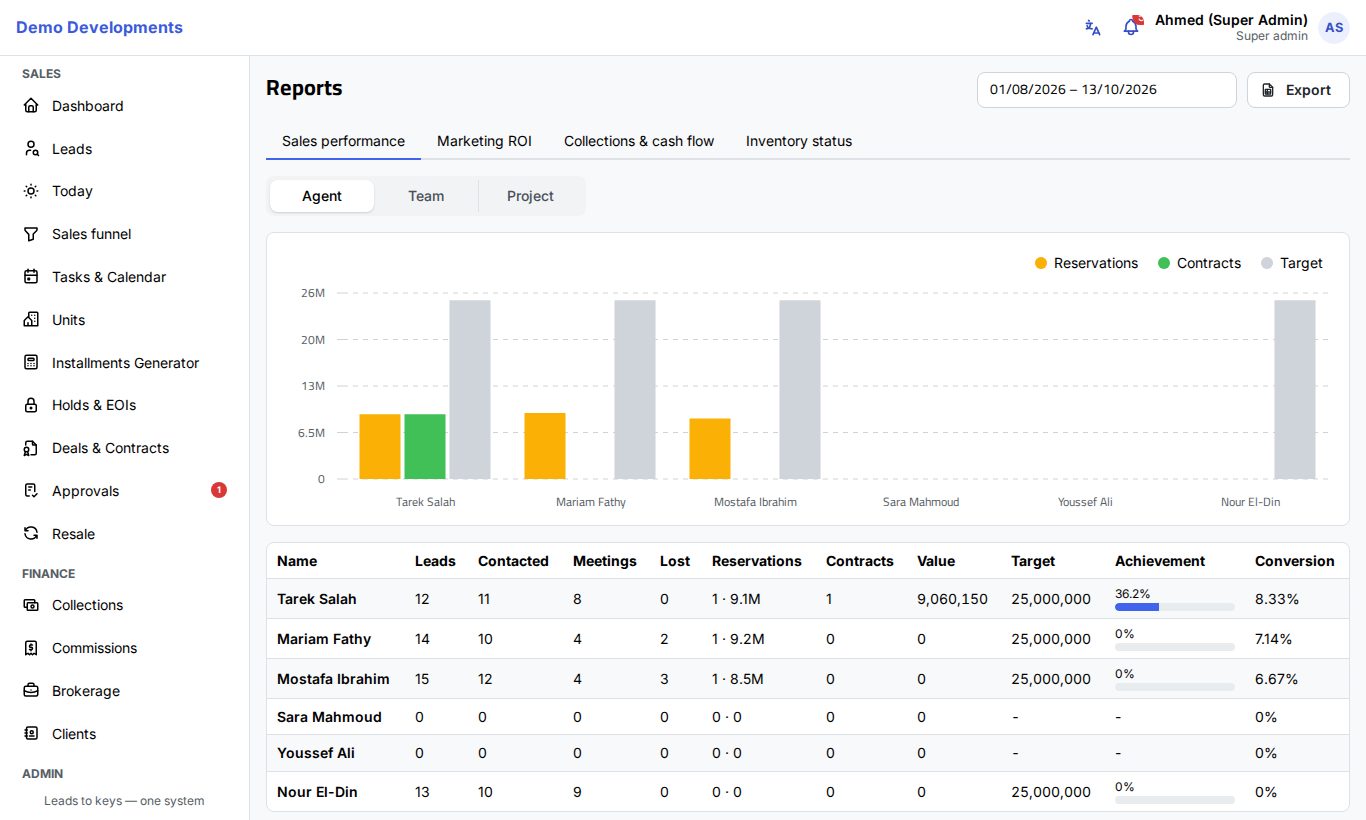
Shows, for each agent, team or project, how leads turned into reservations and contracts, and how that compares with the target.
- Choose Agent, Team or Project to group the rows.
- Set the date range.
The chart shows, for the first 15 rows, the value of Reservations, the value of Contracts and the Target. The table shows:
| Column | What it counts |
|---|---|
| Name | The agent (sales agents and team leaders), team or project. |
| Leads | Leads that arrived in the period (for projects: leads interested in that project). |
| Contacted | Of those leads, how many were contacted. |
| Meetings | Of those leads, how many are now at the Meeting stage or further (not lost). |
| Lost | Of those leads, how many are lost. |
| Reservations | Deals reserved in the period that are still active, with their value. |
| Contracts | Deals signed by the company in the period. |
| Value | The net value of those contracts. |
| Target | The sum of the monthly targets for the months in the period (not shown for projects). |
| Achievement | Contract value ÷ target, with a bar (green at 100%). |
| Conversion | Reservations ÷ leads, as a %. |
Rows are sorted by contract value, highest first. Targets are set in Settings → Targets (see Teams and targets).
Marketing ROI
Shows what each lead source and campaign brought in, and what it cost.
The cards at the top give the totals for the period: Leads, Spend, Cost/lead, Cost/sale and ROAS (revenue ÷ spend, for example "4.2x"). A chart compares leads and deals by source, and the table has one row per source and campaign:
| Column | What it counts |
|---|---|
| Source and Campaign | Where the leads came from, as recorded on each lead. |
| Leads | Leads that arrived in the period. |
| Qualified | Of those, how many are now Qualified or further (not lost). |
| Deals & Contracts | Active deals made with those leads. |
| Revenue | The net value of those deals. |
| Spend | Ad spend recorded for that source and campaign in the months of the period. |
| Cost/lead | Spend ÷ leads. |
| Cost/sale | Spend ÷ deals. |
| ROAS | Revenue ÷ spend. |
| Conversion | Deals ÷ leads, as a %. |
Recording ad spend
Spend comes from Settings → Ad spend (company admins, sales managers and Marketing): one line per Month, Source and Campaign with the Amount. Lines marked From Meta were synced from Facebook. Spend is matched to leads by source and by the exact campaign name, so write campaign names the same way as on the leads. Spend that brought no leads still shows as its own row. See Marketing and lead sources.
Collections & cash flow
Shows the money expected and collected, what is overdue, and the cheques you hold. Choose a Project to see one project only.
This report does not use the date range: it always covers about the last 5 months and the next 6 months, so you see both what happened and what is coming.
- Expected: the total of installments falling due in that window.
- Collected: the payments received in that window (without reversed payments).
- Overdue: the amount still unpaid on all overdue installments today.
- In default: the number of deals marked in default (for all projects).
- The monthly chart shows, for each month, what was Expected (installments due that month) and how much of it has been Collected. Months ahead show what is still to come.
- Overdue aging splits the overdue amount by how late it is: 0-30, 31-60, 61-90 and 90+ days.
- Cheques gives, for every cheque status, the number of cheques and their total amount (for all projects).
The Excel file also has a sheet with the payments received by method (cash, bank transfer, cheque…), which is not shown on screen.
Installments of cancelled, terminated or rejected deals are left out. For the detailed lists behind these figures, use Collections.
Inventory status
One card per project, showing the units by status: a coloured bar, and a table with the number and total price of units that are Available, Held, Reserved, Contracted, Blocked or Handed over. Sold % counts reserved, contracted and handed over units against all the project's units. This tab always shows the situation today. The Excel file has one row per project with its total units, total value and sold %.
The sales funnel
The sales funnel and the pipeline board have their own page, Sales funnel, in the Sales group of the menu. See Sales funnel.
Good to know
- A deal counts under Reservations in the period it was reserved, and under Contracts in the period the company signed it, so the same deal can appear in both in different months.
- Lead columns (Leads, Contacted, Meetings, Lost, Qualified) count the leads that arrived in the period and their stage today.
- Achievement uses the same monthly targets as the target tiers in Commissions.